Live MVP - Try It Now!
AI-Powered Data
Visualization
Made Simple
Transform your data into beautiful visualizations with natural language. Our MVP connects to your tools and creates interactive dashboards instantly. No coding required.
Natural language queries
Instant visualizations
Live MVP available
Stay updated with new features
What's Working Right Now
Our MVP is live and functional. Here's what you can do today:
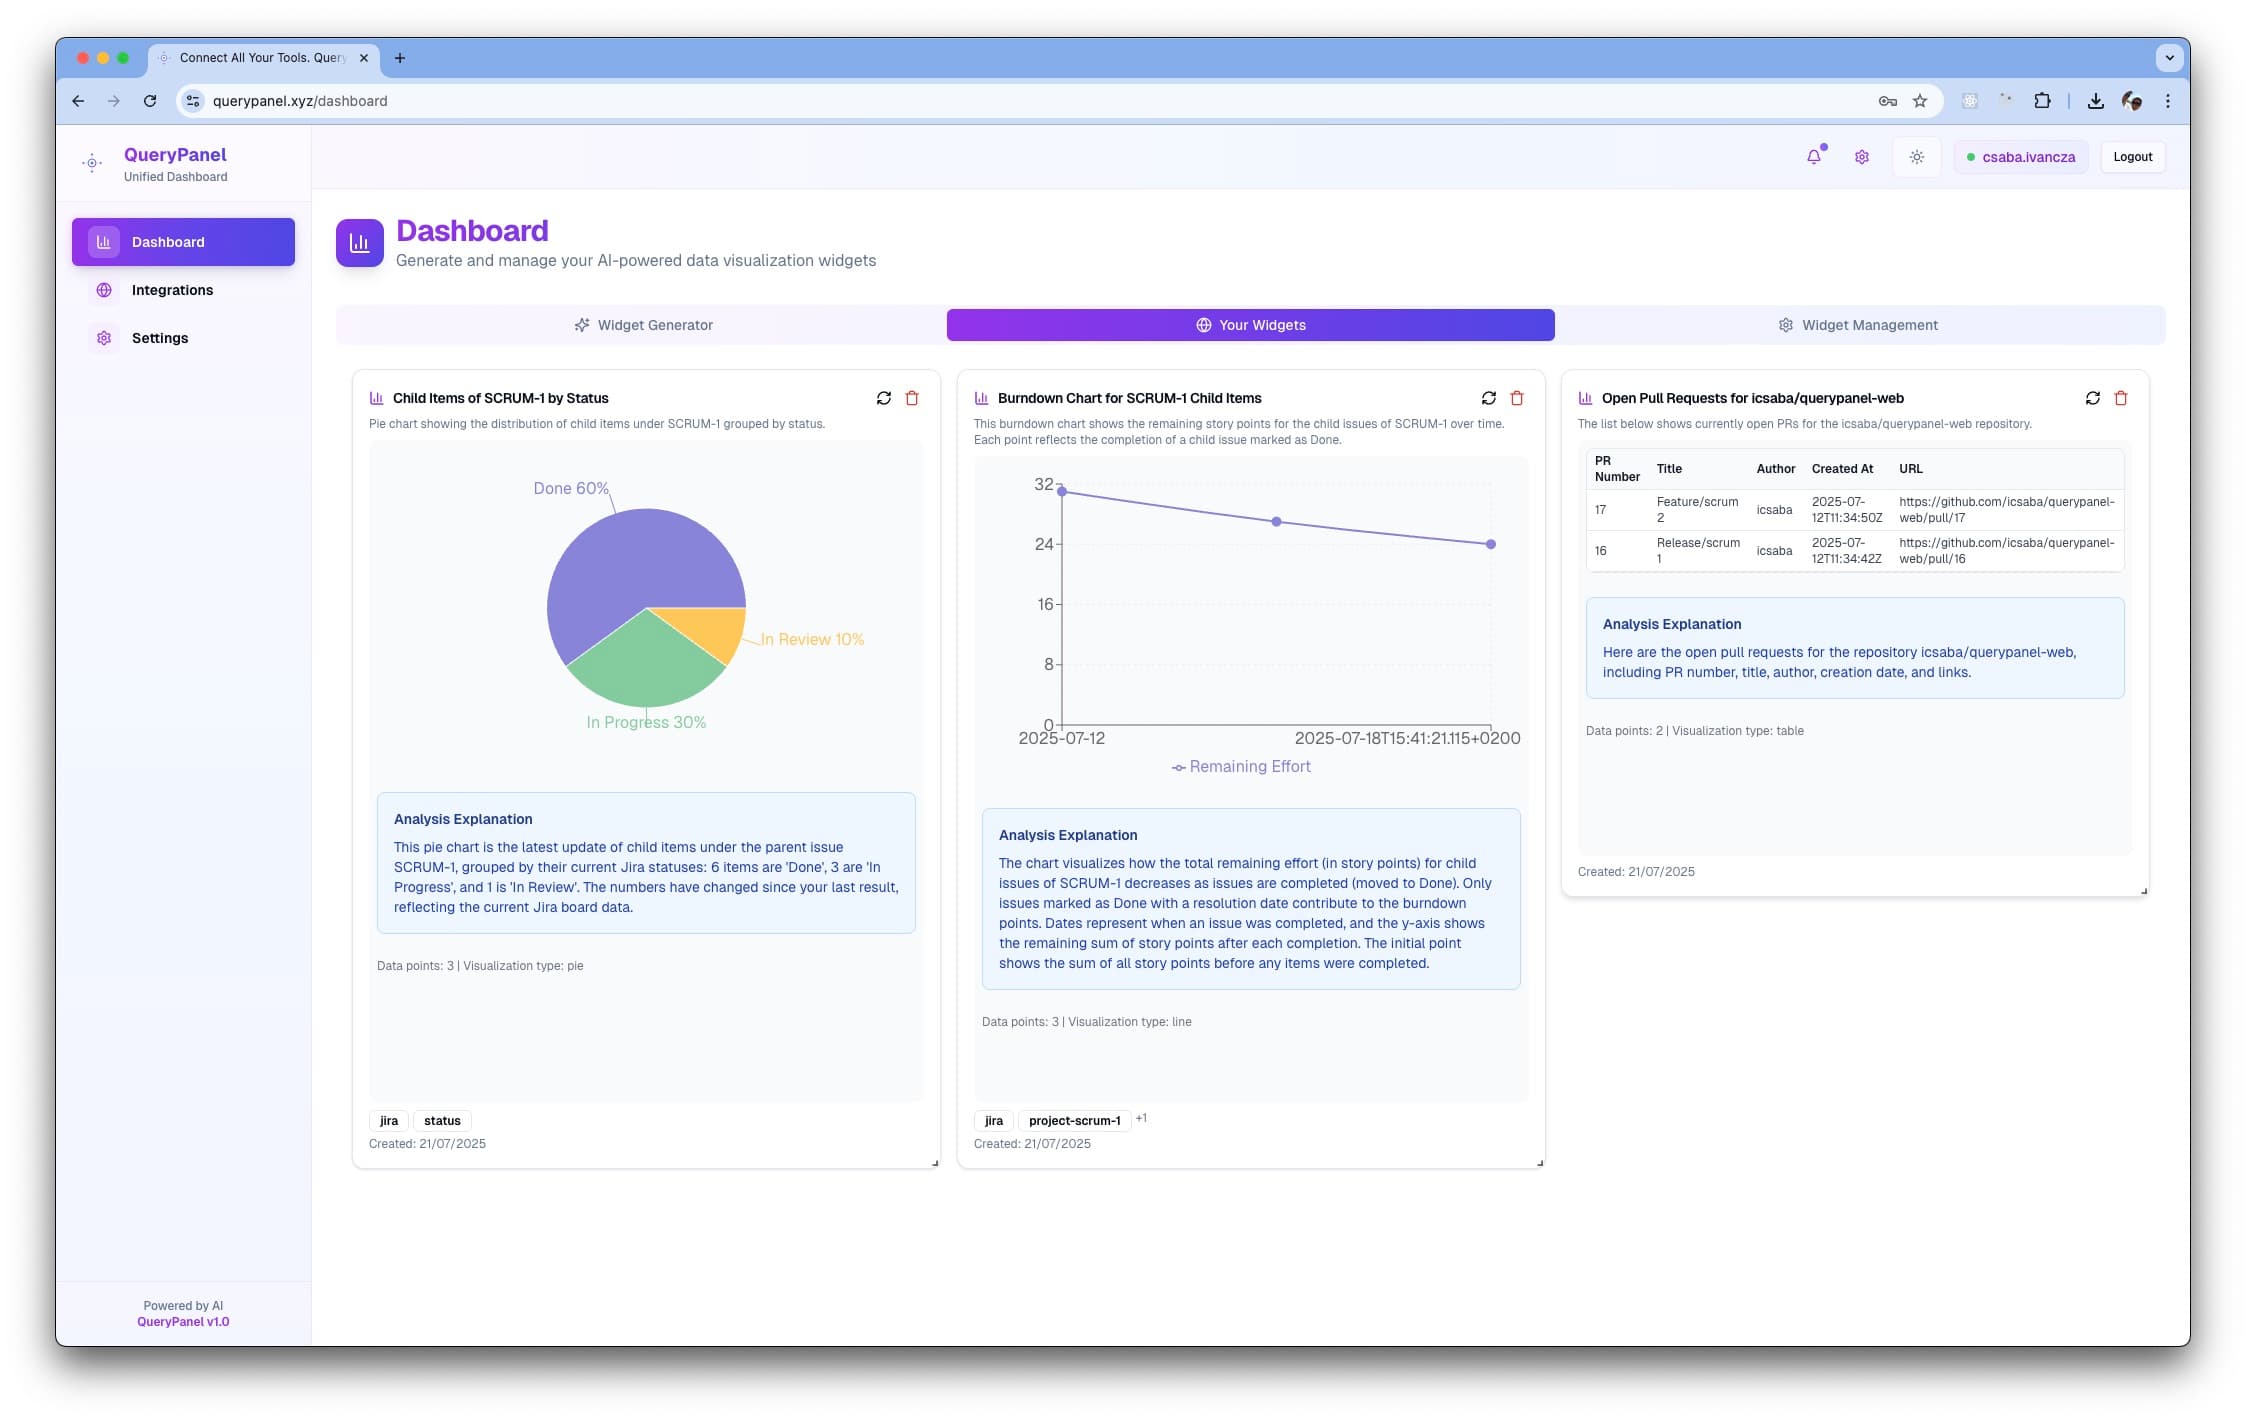
AI Widget Generator
Describe what you want to visualize in plain English. Our AI creates charts, graphs, and dashboards instantly.
Interactive Dashboards
Create, save, and organize your visualizations into customizable dashboards with drag-and-drop layout.
Real-time Updates
Set auto-refresh intervals to keep your data current. Widgets update automatically without manual intervention.
See It In Action
Watch how easy it is to create data visualizations with natural language

Live Demo Video
Real Examples You Can Try
These are actual queries that work in our MVP right now
Sales Analytics
"Show me quarterly sales trends with revenue growth as a line chart"
→ Creates interactive line chart with trend analysis
User Metrics
"Create a pie chart showing user distribution by region"
→ Generates colorful pie chart with percentage breakdowns
Performance Tracking
"Display monthly performance metrics as a bar chart"
→ Builds responsive bar chart with performance indicators
Security Dashboard
"Show security incidents by severity as a stacked bar chart"
→ Produces stacked visualization with severity levels
MVP Status
What This MVP Includes
We're building in public and being transparent about what's available now vs. what's coming next.
Available Now
- AI-powered widget generation
- Interactive data visualizations
- Drag-and-drop dashboard layout
- User authentication & accounts
- MCP tool integrations (GitHub, Jira, etc.)
- Real-time data connections
Coming Soon
- Auto-refresh capabilities
- Team collaboration features
- Advanced chart types
- API access & webhooks
- Interactive reaction based widgets
- Shareable reporting
Start Free, Scale as You Grow
Try our MVP for free. No credit card required. Upgrade when you're ready.
Free MVP
Free
Perfect for trying out our MVP features. No credit card required.
- 10 AI-generated widgets
- Basic dashboard layout
- Standard chart types
- Community support
Most Popular
Pro
$19/mo
For power users who want more widgets and advanced features.
- 100 AI-generated widgets
- Advanced chart types
- Priority support
- Custom branding
Enterprise
Contact Us
Custom solutions for teams and organizations with specific needs.
- Unlimited widgets
- MCP integrations
- SSO & advanced security
- Dedicated support
Ready to Transform Your Data?
Join the early users who are already creating amazing visualizations with our MVP.